U.S. academics script and study the impacts of a sudden nuclear shutdown in the United States
On April 10th, an article entitled “Nuclear power generation phase-outs redistribute US air quality and climate-related mortality risk” was published in the scientific journal Nature (Energy). This research, carried out by a multidisciplinary team of researchers from the Massachusetts Institute of Technology (MIT) and the University of California, seeks to answer, among other things, the question of what would happen if all nuclear power plants in the United States were to be shut down.
Research can and should inform the climate and health effects of energy policies
There is a vast literature on the climate impact of nuclear power plant closures. However, the research that seeks to quantify the effects on air pollution is much less significant, particularly at the national level in the United States, according to the authors [1]. The closure of nuclear capacities leads to their total or partial replacement by fossil fuels, which emit molecules (NOx and SO2) that are precursors to the formation of ozone (NOx only) and fine particulate matter associated with premature mortality and adverse health effects [2]. Thus, in addition to climate issues, the scientific literature highlights a health issue in energy policy choices and a strong social dimension, as we will see below.
To answer these questions, the multidisciplinary team aims to provide quantified elements of response on the interactions between the electricity system, air quality, climate, and health in response to expected future declines in nuclear and/or coal capacities in the United States. To produce these results, scientists will need two main tools.
An energy grid dispatch model coupled with a chemical transport model
It is necessary to have production records to calculate emissions associated with electricity production in a fleet according to various scenarios. Therefore, the first tool used is a simulation model of the hourly call program for the production capacities of the electricity system. These optimization models work with input variables, such as the marginal cost of production of controllable units, transmission capacities between the meshes [3] of the electricity system, and production records of energy recovery. The optimization problem to be solved is to equalize production (adjusted for recovery production) and consumption at each hour of the year on each mesh of the electricity system, subject to the availability of controllable units and transmission between the different meshes. The model is evaluated based on the output data of a reference scenario, compared with data from the United States Environmental Protection Agency (EPA).
In their study, the scientists examine three scenarios: a “base” scenario (B) in which the electricity mix remains unchanged from its current state; a “no nuclear” scenario (N) in which all nuclear capacities are shut down; and a “no nuclear and no coal” scenario (NC) in which all nuclear and coal-fired power plants are closed. These “extreme” scenarios allow scientists to “explore the dynamics of electricity systems in response to the total loss of capacity” and “thus have a measure of the maximum potential impact of such closures.”
The scientists use a chemical transport model to simulate the concentrations of chemical pollutants. This model is based on meteorological data, which explains the interdisciplinary nature of the team. By superimposing the emission grid from the dispatch model on that of the chemical transport model, the scientists obtain daily concentrations of air pollutants (ozone and fine particulate matter) with a fine spatial and temporal resolution.
Results on four levels: technical, environmental, health, and economic
On the technical level, scenarios N and NC are characterized by more fossil generations – as expected. For example, between B and NC, the share of gas in production increases from 32 to 79%. In addition, several power plants, including the most polluting ones, are included in NC compared to B and N. They contribute significantly to emissions: 43% of NOx emissions come from 15 units in NC, whereas only one of these units is included in the reference scenario (B) and accounts for 0.2% of NOx emissions. The figure below provides a geographical view of the differences in production between the three scenarios. It shows the annual difference in output between B on one side and N (map b) and NC (map c) on the other. Only production increases by the technological group are shown. Thus, on map b: brown circles represent the increase in coal production in N compared to B, following the closure of nuclear capacities (whose production is represented by red circles on map a). It should be noted that most changes occur in the eastern part of the United States.
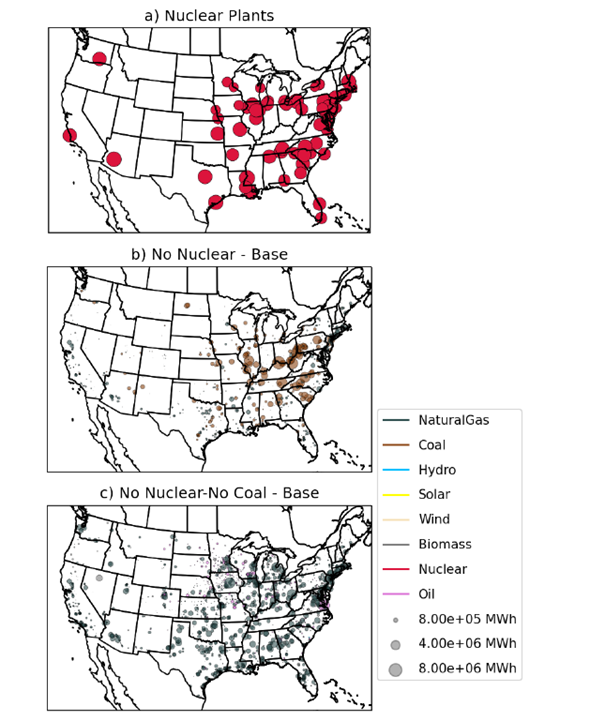
Figure: Difference in production mix across scenarios B, N, and NC
Surprisingly, and not without importance for supply security, to ensure that the optimization program works properly, scientists “artificially” add capacity to N and NC at a very high marginal cost (these will be the last called on the grid) with zero emissions. As a result, in Texas, these capacities are called upon for 20 hours in May. This implies that without these fictional capacities, there would have been curtailment, shortages, and even blackouts depending on the maturity and effectiveness of demand response (and reserve) mechanisms, the temporal dynamics of the supply-demand deficit, and its magnitude.
On the environmental level, it has been observed that emissions increase in N and NC compared to B. While the closure of coal-fired capacity helps to reduce SO2 and CO2 emissions, it significantly worsens the NOx emissions balance due to increased use of highly polluting gas and oil-fired power plants. The graph below summarizes the study results.
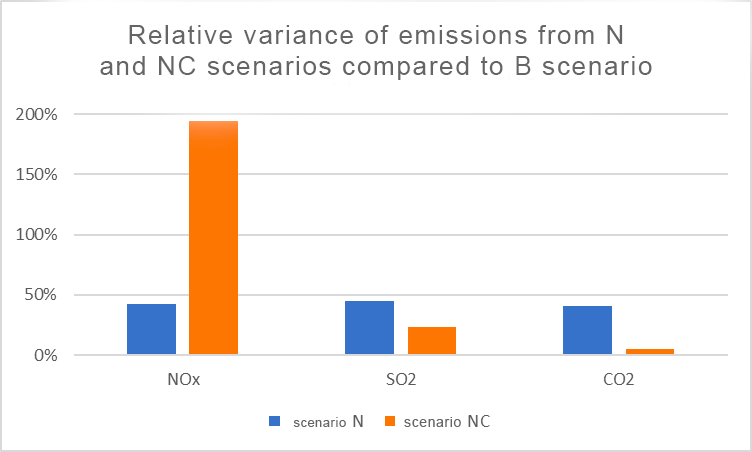
Figure: Relative difference in emissions between scenarios
On the health level, the impact is calculated using two metrics depending on whether the health effects are due to CO2 emissions or air quality. The impact of the former [4] only occurs in the long term (deaths should be reported throughout the 21st century). In contrast, the health impact of air pollution [5] is established over one year of production/emission.
Depending on the calculation assumptions, CO2 emissions in N result in the death of 80,000 to 160,000 individuals compared to B, and 11,000 to 22,000 individuals in NC compared to B (remember that emissions are lower in N than in NC with the closure of coal-fired power plants).
Changes in ozone and fine particulate matter concentrations related to changes in the electricity mix emissions lead to 9,200 premature deaths in N compared to B and 8,400 premature deaths in NC compared to B.
In addition, the granularity of the grid used to quantify pollutant and GHG emissions highlights a differentiated impact among different racial and ethnic groups – this is what we referred to at the beginning of the article as “strongly intertwined with a social dimension.” Exposure to fine particulate matter and photochemical ozone is not homogeneous among different social groups: African American populations are much more exposed (see tables from the study below). The geography of production means remains largely unaddressed in the public space. However, it is, like the choice of mix, an axis of reflection of energy policy that covers major social justice issues.
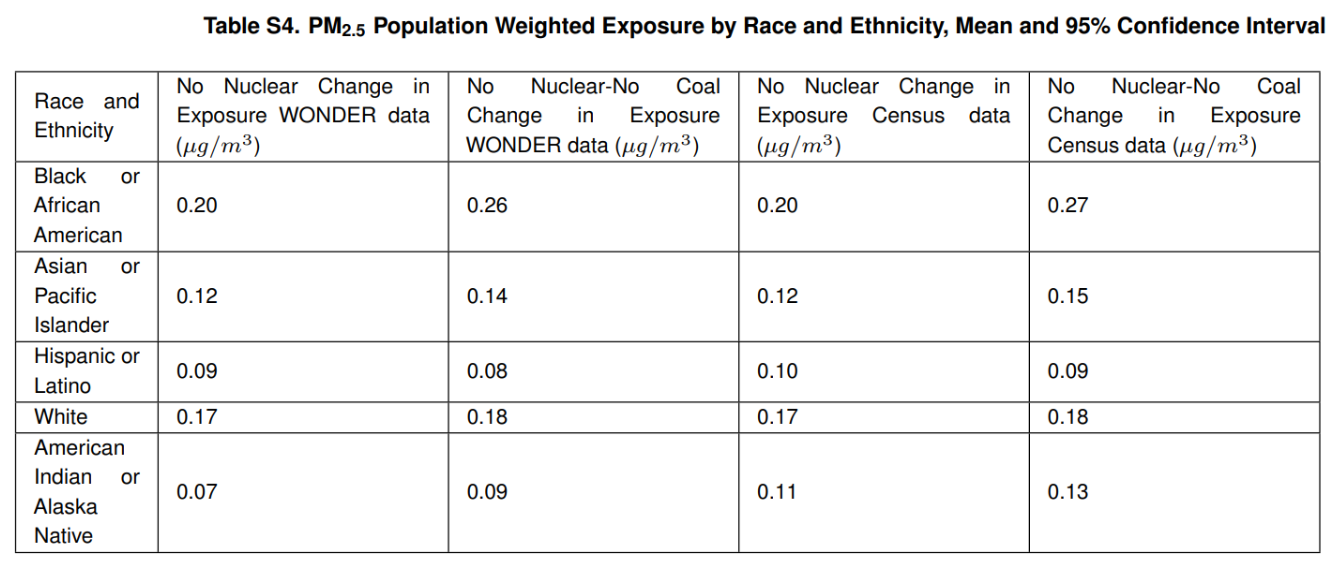
Table: Mortality due to fine particulate matter concentration by social groups.
On the economic level, it is essential to note that the economic calculation to obtain a social cost of carbon, or even more difficult, to measure the value of lost lives, is the subject of lively discussions in the literature. The results must be handled according to precise modalities, for example, to compare the overall economic impact of public policies. With these precautions taken, scientists arrive at the following results. Compared to a reference scenario, N leads to an additional annual cost for the US community ranging from $85.6 to $131 billion. In comparison, NC leads to an additional yearly cost ranging from $86.4 to $92.5 billion. These assessments are most likely underestimated in their social cost of carbon component since methane emissions should be considered part of the study’s limitations.
Limitations of the Exercise
Several axes, some of which were raised by the study’s authors, could be further explored. First, the scope of greenhouse gas emissions does not include methane (a powerful greenhouse gas). The reason is the uncertainties in quantifying emissions, a recognized subject among specialists. Comparing the model’s output data with real data shows that the model significantly underestimates methane emissions. This leads the authors to leave out these emissions in the interest of scientific ethics.
Another area for improvement highlighted is to consider in the model the investment in new capacity to replace – one would assume – partially decommissioned nuclear and/or coal capacity. Finally, to complete the economic evaluation of the costs of scenarios N and NC compared to B, it would have been judicious (1) to take into account the statistical cost of a nuclear accident (or the externalities related to radioactivity and reported per MWh of nuclear energy produced) (2) to take into account the differences in cost related to electricity generation (difference between the marginal production costs of the groups called in the different scenarios). ■
[1] For a study on the German case: S Jarvis, O Deschenes, A Jha, The Private and External Costs of Germany’s Nuclear Phase-Out (2019).
[2] Q Di, et al., Air Pollution and Mortality in the Medicare Population. New Engl. J. Medicine (2017); MC Turner, et al., Long-Term Ozone Exposure and Mortality in a Large Prospective Study. Am. J. Respir. Critical Care Medicine (2016).
[3] The model uses NEEDS data that divides the United States into 64 zones.
[4] To calculate the health impact of carbon emissions, the authors measure marginal mortality generated by emissions. See https://legrandcontinent.eu/fr/2022/05/25/theorie-et-pratique-de-la-violence-du-carbone/ or https://www.nytimes.com/2021/07/29/climate/carbon-emissions-death.html. NB: the method is the subject of much academic discussion.
[5] The health impact of fine particles and ozone is quantified using a concentration-response function.
[6] Some discussions on this subject: are Lisa Heinzerling’s “The Rights of Statistical People” (2000), Ethan Cas’s “The Value of statistical life and the social cost of Carbon” (2013); Marion Fourcade, Cent and Sensibility: Economic Valuation and the Nature of “Nature” (2011).
[7] IRSN: Review of the cost-benefit analysis method for safety (2007)